

Global warming a constant upward trend, WMO figures reveal
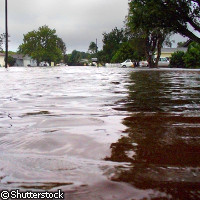
As governments meeting in the Danish capital of Copenhagen work to hammer out a global deal to tackle climate change, new figures from the World Meteorological Organization (WMO) place 2009 among the top 10 hottest years since records began in 1850. The figures show that temperatures are rising steadily, with the years from 2000 to 2009 hotter than the 1990s, which were in turn hotter than the 1980s. Meanwhile, scientists have developed a new tool that demonstrates the scale of the impacts of climate change. According to the WMO figures, above-average temperatures were recorded in most parts of the world except North America, which experienced cooler-than- average temperatures. Many extreme weather conditions were recorded by the WMO, including floods, droughts and heat waves. China suffered its worst drought in five decades, and severe and prolonged droughts also occurred in Argentina, south-eastern Australia, East Africa, India and Mexico. In Kenya the drought caused a 40% decline in the country's maize harvest. In West Africa, rainfall was so intense in September that more than 100,000 people were affected. Burkina Faso experienced the worst rainfall in the region for 90 years, more than 263 mm of rain in less than 12 hours. Many other parts of the world were also badly affected by extreme rainfall. Floods, tornados and heavy thunderstorms caused much damage across Germany. The United Kingdom also experienced severe flooding and more than 300 mm of rain was recorded in less than 48 hours in south-eastern Spain as well as across other regions of the Mediterranean. South and central America were also hit by unusual rainfall which led to flooding in Argentina, north-eastern Brazil, Colombia and Uruguay. Landslides caused by flooding also led to hundreds of deaths in Colombia and El Salvador. Canada experienced many extreme weather conditions including almost double the normal number of avalanches and a record number of tornados which resulted in 25 deaths. The northern plains region of the US also experienced the wettest October for 115 years and record flooding during March. The data from the WMO is based on a variety of data sources including land-based climate stations, ships and satellites. The final figures for 2009 will be published in March 2010 in the annual WMO Statement on the Status of Global Climate. Meanwhile, the IGBP (International Geosphere-Biosphere Programme) has released details of a new tool, called the IGBP Climate Change Index, to track global warming. The index was the brainchild of a group of IGBP scientists who were concerned that current climate change data are often confusing and not clear enough about the scale of the changes that are happening; it constitutes an attempt to simplify data and reveal general trends in climate change. The index charts changes in four key indicators of climate change: temperatures, sea ice, sea level, and carbon dioxide. It reveals a clear upward direction in climate change since 1980, the first year covered by the tool. 'We needed an oceanic measure and chose sea-level rise because the impact is global and of high public interest,' said Professor Steven Running from the University of Montana, US, one of the creators of the index. 'The fourth metric concerns the cryosphere. Growing concern about the rate of loss of summer sea ice in the Arctic led us to choose this metric. This parameter broadly represents the Earth system and it is interesting that the summer sea ice extent is shrinking much faster than models predicted five or two years ago.' The IGBP is a research programme that is studying global climate change in order to provide scientific evidence to help make the Earth and its ecosystems more sustainable.